Sunday, August 30, 2009

Trading Strategy - Ambush Trade


(Taken from SandP50analyst.com)

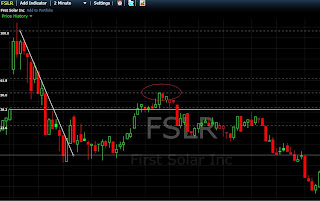
When you have a dramatic move up or down, people try to chase it. You should use a 2 min chart for this. So for example:


FSLR - within the first 30 mins of open, this thing gapped down hard.

What you do is wait for it to kind of bottom out. Once it has bottomed out, draw a Fibonacci retracement from the beginning of the fall to the end (where it bottomed out). Now the 50% retracment is where the ambush will happen. You want to put a short order around that 50% retracement. You can confirm that it will move down from the 50% by waiting for the candle that hit the 50% to be formed. THe second candle should have closed lower than the low of the previous candle.

Trading Strategy - Using an oversold TRIN

Taken from SandP500analst.com

When the TRIN hits 1.5, you want to buy the S and P 500 (you can go long a call for maximum profits).

VIX

When market is up, VIX is down.
When market is down, VIX is up.

If market is up, say, 3% - you want the VIX to be down almost by double. Anywhere from 5-7% (or higher).

If market is up 3%, and VIX is only down 1.5%, it does not really confirm the up move.

If market is up 1% and VIX is down alot, like 10%, than that is very bullish.
If market is down 1%, and VIX is up a lot, like 10% than that is very bearish.

Saturday, August 22, 2009

Candlesticks (taken from www.traderslog.com)

  • zeeshan and if it abandoned baby is above the previous day candle, this is bearish
    Details
    9/23/09 9:19 am
    #
  • zeeshan if the abandoned baby is below the previous day candle, that is bullish


Candlesticks are best used for 5 min, hourly, daily etc. Nothing too short term...too much noise.

EXCELLENT SITE FOR CANDLESTICKS:


http://www.traderslog.com/Japanese-Candlesticks.htm


HAMMER


The hammer is known as a reversal candlestick. Hammer candlesticks occur when a security moves significantly lower after the open, but rebounds to close well above the intraday low. In a perfect hammer, this tail is twice the length of the body and the candlestick will have no upper shadow or wick. The smaller the body and the longer the tail, the more significant the hammer is as a bullish indicator. Hammers form at trend bottoms. If this candlestick forms during an advance, it is called a Hanging Man.


INVERTED HAMMER

The Inverted Hammer is a bullish reversal Japanese Candlestick pattern. In a downtrend, the security opens lower, then trades higher, but closes near where it opened. The candlestick has a long upper shadow/wick and a small real body at the lower end of the session.


HANGING MAN

On a Japanese Candlestick chart, the Hanging Man candlestick occurs when a security moves significantly lower after the open, but rebounds to close well above the intraday low. The Hammer and Hanging Man are short body candles with little or no upper shadow or wick, and a lower shadow at lease twice the height of the candle body. They are reversal candlesticks: hammers form during a decline at trend bottoms, the bearish Hanging Man forms during an advance.


ENGULFING PATTERNS

A reversal pattern on a Japanese Candlestick chart that can be bearish or bullish depending upon whether it is in an uptrend or downtrend. An Engulfing Pattern is a two candlestick pattern, where the first day is characterized by a small body, followed by a day whose body completely engulfs the previous day's real body. The second day's real body (candle) should be the opposite color of the first real body. The bearish engulfing pattern signals the end of an uptrend and the bullish engulfing pattern suggests a downtrend reversal.


Thursday, August 20, 2009

MACD

MACD is a lagging indicator (meaning not good for intraday trading) but you can tweak it to help you a bit. Format is (fast K, slow K, signal).

Standard is (12,26,9). A modified version that can help during intraday is (5,9,2).

A bearish divergence occurs when the market makes a higher high than the previous high, but the MACD indicator fails to make a corresponding high.

A bullish divergence occurs when the market makes a lower low, but the indicator doesn't make a corresponding low.

Wednesday, August 19, 2009

Fibonacci Retracements

The fibonacci retracements pattern can be useful for swing traders to identify reversals on a stock chart.

To draw it,you start at either the high point or low point of the chart. Start with which ever happened first.

Most important fib lines (for sandp500analyst) are 50 and 61.8.

If stock goes down and comes back up, it is most likely to hit resistance at 50 or 61.8. A close above 61.8 is no longer a play the down side.

Confirmation for the continued move downward would be a close beneath the low of the high candle. Meaning: Stock goes up and hits 61.8. Next day it falls. Day after that, if the stock closes below the low point of the previous day (first day stock fell after hitting 61.8) you have confirmation of reversal.

Long term lines: 123% (for a long term resistance) and -23% (long term support).

Thursday, August 13, 2009

Technical Indicators

MACD

Use - 8/20 MACD with a trigger of 9
Use in conjuction with the 3/7 simple moving average

A bearish divergence occurs when the market makes a higher high than the previous high, but the MACD indicator fails to make a corresponding high.

A bullish divergence occurs when the market makes a lower low, but the indicator doesn't make a corresponding low.

CCI

CCI of over +100 indicates a strong bull trend
CCI of under -100 indicates a strong bear trend

Execute long position once CCI reaches 100 and sell the position when it falls back to 85
Execute sell when CCI falls below -100 and liquidate position when it reaches -85

Stochastics

When both lines are...

Below 20 - oversold
If below 20, buy signal is triggered when %k line crosses over the %d lines

Above 80 - overbought
If above 80, sell signal is triggered when %k line crosses below the %d line

Williams AD

Distribution - When the market is making a new high and the AD indicator fails to follow, then a sell signal is generated
Accumulation - When the market is making new lows and the AD fails to follow, then a buy signal is generated


Williams %R

Use 10 day.
When the %R rises from below 20% to greater than 20%, a buy signal is triggered.
When the %R falls from above 80% to below 80%, a sell signal is triggered.


Bollinger Bands

Buy signal created when market goes lower than the lower band, sell indicator when market goes above upper band.
Wider bands indicate high volatility, narrow indicates low volatility

Market Internals (taken from sandp500analyst.com)

TRIN ($TRIN)

A contrarian indicator to detect overbought and oversold levels in the market. Because of its calculation method, the TRIN has an inverse relationship with the market.

Trending up = bearish Trending down = bullish

If the trin stays between =
.45-.60 = bullish
.65- .80 = neutral
.85- .95 = bearish, over 1.00 = bearish


First test of 1.5 = Over sold, buy signal
First test of 2 = Over sold buy signal

If TRIN opens at 2 and starts going down, that is a buy signal.

TICK ($TICK)

The Ticks compares the number of upticking (price increasing) and downticking (price decreasing) stocks on the NYSE (New York Stock Exchange), and calculates a ratio showing whether there are more upticking or downticking stocks.

Trending up = bullish Trending down = bearish

Over bought = + 800 and +1000
Over sold = -800 and - 1000

If you are preparing to go long, and you get a + 800 TICK reading, you may be better off waiting for a pullback. That's even if you're trading a stock and not an index. They can be used very effectively in conjuntion with major support/resistance areas.

You can also look to trade took hooks up or down, that take place near the low or high of the TICK's range for that day.

VIX ($VIX)

The CBOE Volatility Index® (VIX®) is a key measure of market expectations of near-term volatility conveyed by S&P 500 stock index option prices. Since its introduction in 1993, VIX has been considered by many to be the world's premier barometer of investor sentiment and market volatility.

Trending up = bearish Trending down = bullish

If market is up, vix down = bullish, If market is down, vix up = bearish, Market up, vix up = bearish and vice versa

Market Breadth ($ISSU)

Trending up = bearish Trending down = bullish

If the market breadth is over 1.5 = bullish, better to look for long entries, between 1.5 and .5 = neutral, under .5 = bearish, I will only look for short entries

Put/call (PCC-ST)

Trending up = bullish Trending down = bearish

If the put/call ratio stays below = .45 = very bearish, .45-.65= bearish, .65- .75 = slightly bearish, .70- .85= neutral, .85-.95 = bullish, over 1 = very bullish

Chart Patterns (taken from investopedia.com)

A note on chart patterns: they work best on 5 min, 30 min, hourly, daily charts. Anything too short term and the patterns don't mean much.


Head and Shoulders

Head and shoulders is a reversal pattern that, when formed, signals the security is likely to move against the previous trend. There are two versions of the head-and-shoulders pattern. The head-and-shoulders top is a signal that a security's price is set to fall, once the pattern is complete, and is usually formed at the peak of an upward trend. The second version, the head-and-shoulders bottom (also known as inverse head and shoulders), signals that a security's price is set to rise and usually forms during a downward trend.


Symmetrical Triangle


The symmetrical triangle is mainly considered to be a continuation pattern that signals a period of consolidation in a trend followed by a resumption of the prior trend. It is formed by the convergence of a descending resistance line and an ascending support line. The two trendlines in the formation of this triangle should have a similar slope converging at a point known as the apex. The price of the security will bounce between these trendlines, towards the apex, and typically breakout in the direction of the prior trend.

Ascending Triangle

The ascending triangle is a bullish pattern, which gives an indication that the price of the security is headed higher upon completion. The pattern is formed by two trendlines: a flat trendline being a point of resistance and an ascending trendline acting as a price support.


Descending Triangle

The descending triangle is the opposite of the ascending triangle in that it gives a bearish signal to chartists, suggesting that the price will trend downward upon completion of the pattern. The descending triangle is constructed with a flat support line and a downward-sloping resistance line.


Double Top

The double-top pattern is found at the peaks of an upward trend and is a clear signal that the preceding upward trend is weakening and that buyers are losing interest. Upon completion of this pattern, the trend is considered to be reversed and the security is expected to move lower.

Put a long order slightly above resistance and a short order below support (support line is where the trends bottoms out after top #1)

Double Bottom is simply the opposite of this.


The Flag


The flag pattern forms what looks like a rectangle. The rectangle is formed by two parallel trendlines that act as support and resistance for the price until the price breaks out. In general, the flag will not be perfectly flat but will have its trendlines sloping.

In general, the slope of the flag should move in the opposite direction of the initial sharp price movement; so if the initial movement were up, the flag should be downward sloping.

The buy or sell signal is formed once the price breaks through the support or resistance level, with the trend continuing in the prior direction. This breakthrough should be on heavier volume to improve the signal of the chart pattern.

Island Gap Reversal
One of the most well-known gap patterns is the island reversal, which is formed by a gap followed by flat trading and then confirmed by another gap in the opposite direction. This pattern is a strong signal of a top or bottom in a trend, indicating a coming shift in the trend.