Sunday, October 25, 2009
Trading Strategy - Using Fibonacci on a Head and Shoulders
Chart Patterns - Head and Shoulders
For confirmation, look for a close beneath the neckline as well as increased volume on the day it closes beaneath neckline.

Head and Shoulders
Head and shoulders is a reversal pattern that, when formed, signals the security is likely to move against the previous trend. There are two versions of the head-and-shoulders pattern. The head-and-shoulders top is a signal that a security's price is set to fall, once the pattern is complete, and is usually formed at the peak of an upward trend. The second version, the head-and-shoulders bottom (also known as inverse head and shoulders), signals that a security's price is set to rise and usually forms during a downward trend.
Also check others in their sector. Is their sector showing weakness or strength? Weakness could help confirm the down movement.
Head and Shoulders
Head and shoulders is a reversal pattern that, when formed, signals the security is likely to move against the previous trend. There are two versions of the head-and-shoulders pattern. The head-and-shoulders top is a signal that a security's price is set to fall, once the pattern is complete, and is usually formed at the peak of an upward trend. The second version, the head-and-shoulders bottom (also known as inverse head and shoulders), signals that a security's price is set to rise and usually forms during a downward trend.
Sunday, October 18, 2009
Trading Strategy - 30 Minute Gap Up
Sunday, August 30, 2009
Trading Strategy - Ambush Trade

(Taken from SandP50analyst.com)
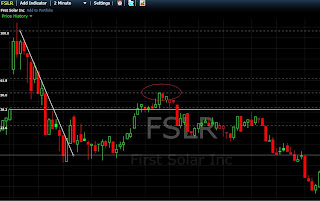
When you have a dramatic move up or down, people try to chase it. You should use a 2 min chart for this. So for example:
FSLR - within the first 30 mins of open, this thing gapped down hard.
What you do is wait for it to kind of bottom out. Once it has bottomed out, draw a Fibonacci retracement from the beginning of the fall to the end (where it bottomed out). Now the 50% retracment is where the ambush will happen. You want to put a short order around that 50% retracement. You can confirm that it will move down from the 50% by waiting for the candle that hit the 50% to be formed. THe second candle should have closed lower than the low of the previous candle.
Trading Strategy - Using an oversold TRIN
Taken from SandP500analst.com
When the TRIN hits 1.5, you want to buy the S and P 500 (you can go long a call for maximum profits).
When the TRIN hits 1.5, you want to buy the S and P 500 (you can go long a call for maximum profits).
VIX
When market is up, VIX is down.
When market is down, VIX is up.
If market is up, say, 3% - you want the VIX to be down almost by double. Anywhere from 5-7% (or higher).
If market is up 3%, and VIX is only down 1.5%, it does not really confirm the up move.
If market is up 1% and VIX is down alot, like 10%, than that is very bullish.
If market is down 1%, and VIX is up a lot, like 10% than that is very bearish.
Subscribe to:
Comments (Atom)
